I recently felt a bit down about my performance in the realm of winning external funding because I had frankly not won any grants recently. I could feel my imposter syndrome flaring up and I should take my own advice: pursue an honest, caring evaluation (my imposter syndrome blog). Who cares more about me than me? What’s more honest than data? So here is my process in how one can evaluate proposal success and here lies my evaluation of my success. This post differs from my first blog post on proposals, which proposes how many proposals to write (input effort), in that this blog post focuses on the process and results (process and output outcome).
Why Care about Proposals and Performance?
Every tenure-track early career faculty is likely told on day one: papers and proposals, rinse, repeat. Proposals, which lead to grants, enable principal investigators to pursue ambitious projects that may need more financial support than small internal seed grants. Universities care about your funding success from the perspective of running a business because grants support all the facilities and people that make up the educational institution. If you can accept that winning proposals is important, then you should also care about reflecting on your performance of winning proposals. You’ll probably learn something from a self-reflection that could improve your ability to win funding.
Data Collection for Analysis
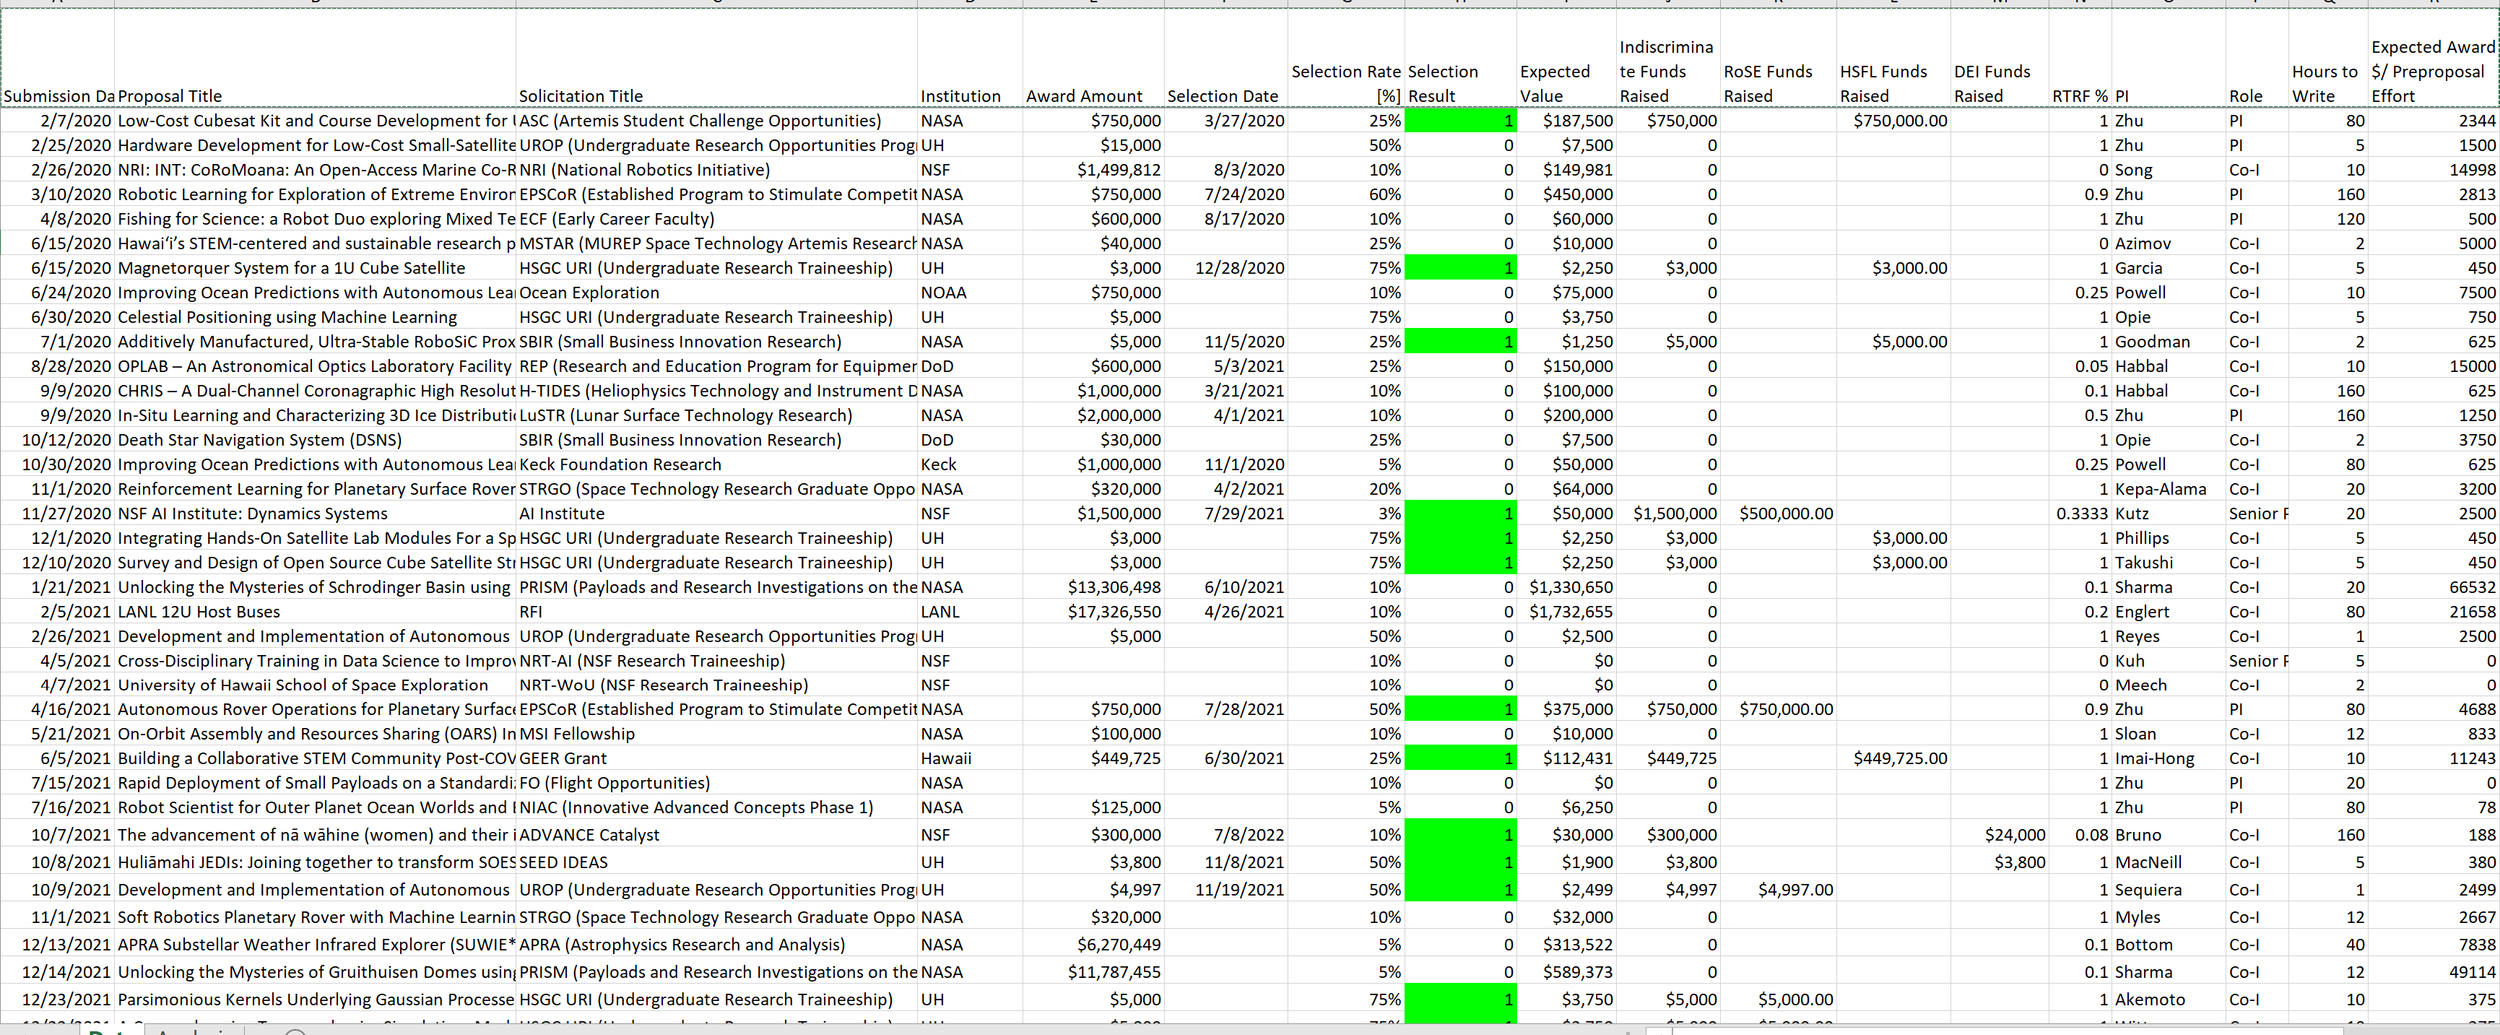
To seed your analysis, I recommend recording the following information; I’ve attached reasons why to each data dimension. I imported all of this information into an Excel spreadsheet, screenshot above.
Submission Date - for time-dependent relationships. I disaggregate information by year.
Proposal Title - for the proposed research topic. Perhaps there’s a trend in the type of research I do that’s most marketable.
Solicitation Title - for the solicitation program. Perhaps I have better luck with certain program types than others.
Institution - the funding agency. Perhaps I have better luck with certain agencies than others.
Award Amount - for the size of award dependence. This column is to keep track of the total amount of money I’ve pursued.
Selection Date - the difference between submission and selection date is the period the funding agency takes to evaluate proposals. I’m interested in this turnaround time for internal planning purposes.
Selection Rate [%] - a real scalar value between [0 1] that captures the probability of success if the selection process is random. The funding agencies hate giving out the selection rate so this number is typically a guess on your part. For limited submissions like EPSCoR, I estimate a selection rate of 25%. For competitive submissions like NSF open calls, I estimate 10%. For extremely competitive submissions like NASA spaceflight missions, I estimate 2-5%. This number is typically inversely correlated with the award amount.
Expected Value - Selection Rate * Award Amount
Selection Result - binary that indicates 1 for success and 0 for rejection.
Indiscriminate Funds Raised - the amount of the award if the selection result indicates success. This column is to keep track of the total amount of money I’ve won. The following subcategories are so I can keep track of how much money I’ve won for different research topics I care about:
RoSE (Robotic Space Exploration) Funds Raised
HSFL (Hawaii Space Flight Lab) Funds Raised
DEI (Diversity Equity Inclusion) Funds Raised
RTRF % - “RTRF is a research and training revolving fund that distributes indirect cost revenues to the campuses of the University of Hawai‘i”. When I submit proposals, I am assigned a percentage amount that indicates how much of the award’s indirect cost goes back to my home department. This number correlates with proposal effort.
PI - name of the principal investigator. Maybe there are trends in who I have more success with. If anything, this column reflects who I see myself collaborating with.
Role - I use this field to disaggregate awards into PI vs Co-I awards.
Hours to Write - to quantify effort in writing and submitting proposal.
Expected Award $/ Preproposal Effort - Expected Value / Hours to Write indicates whether the proposal was worth my time in that I want this value to be above my hourly rate.
Proposal Success Analysis
Disclaimer: I’m me and you’re you. I have a certain set of qualifications and interests. I have a certain writing style and energy level. We differ in so many ways that while I may be representative of some of your experiences, you should not hinge your proposal writing career on mine. Consider my experience a single data point and inform yourself with as many folks’ experiences as possible; the more similar they are to you, the more representative they may be of your experience.
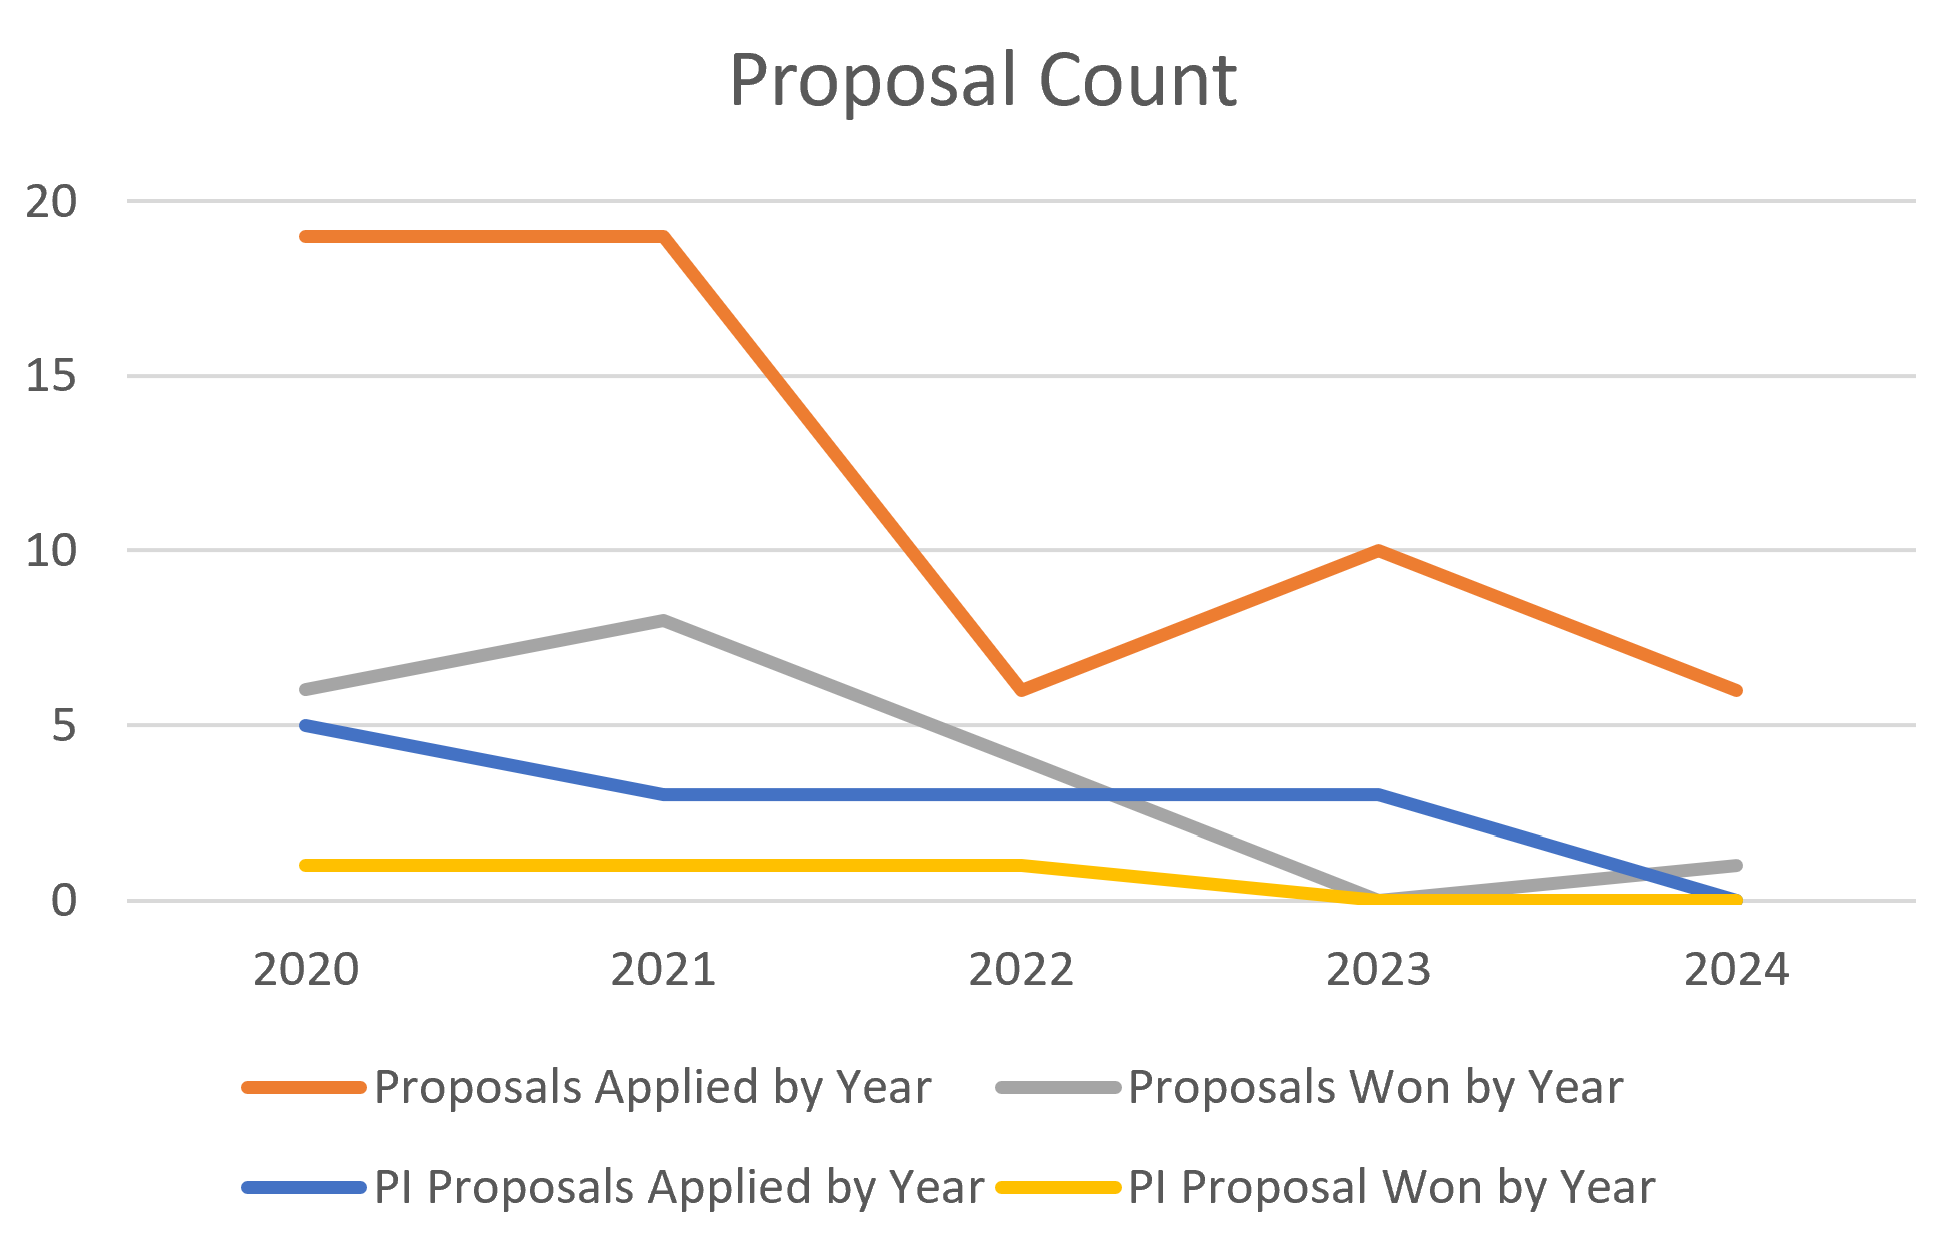
I've applied to the most proposals in my first two years with a steady decline over time. Same trend holds with PI proposals. That makes sense to me since I was very thirsty for funding my first two years. As I received funding, I applied to fewer proposals and I spent more time managing funded projects.
I am justified in feeling bad about my lack of winning proposals in the recent past because I’ve had a dry spell in 2023 (no winning proposals) and only a single winning Co-I proposal in 2024.
My selection rate calculated by number of proposals won / number of proposal submitted is 34%. My selection rate calculated by amount of funding won / amount of funding pursued is 6%. These numbers implies that my success rate depends on the size of the award, which will be shown in a following figure.
My overall selection rate was highest in 2022, and PI selection highest in 2021 and 2022. My overall selection rate, which includes co-I awards, is higher than my PI selection rate.
There's quite a bit of variation across the years so one cannot rely on an average success rate from year to year.
I've spent less time on proposals over the years as I won grants and had to transition to project management.
Despite submitting the same number of proposal in 2020 and 2021, I spent less time on proposals in 2021 than 2020 in part due to submitting fewer PI proposals and likely due to higher proposal submission efficiency.
2022 was a unique year in disproportionately high proposal success despite low effort.
2023 was another unique year in disproportionately low proposal success despite more effort than 2022.
This plot is a little misleading because the total funds raised includes overhead and co-I subawards. The subcategories only include the funds that I received: my piece of the pie.
The category of research that received the most funding was my work with the Hawaii Space Flight Lab, followed closely by the Robotic Space Exploration Lab, then trailed distantly by the DEI Initiatives.
My overall win rate is relatively constant by the amount of effort I put in by year.
When I PI proposals, I actually see a positive trend in effort and success rate.
That actually makes me feel better because my success rate feels like it’s under my control a bit.
The most dramatic effect I see in trends is that amount of money won is definitely correlated with effort, particularly in co-I awards.
That makes me feel even better in thinking that the amount of money won is directly correlated with my effort.
When I asked ChatGPT to generate a word cloud of my proposal titles separated into the successful proposals and all proposals, I can see trends in the types of topics I have success with: dynamics systems, artificial intelligence, planetary surfaces, cubesats, autonomous rovers, undergraduate research. That makes me feel good that the topics I care most about are properly reflected in the awards that I win.
When I asked ChatGPT about my success rates for the specified institutions,
UH (University of Hawaii): 71.4% (highest success rate)
NSF (National Science Foundation): 40.0%
NASA: 25.0%
DoD (Department of Defense): 0.0% (lowest success rate)
I feel affirmed that internal funding is easier to win than external funding. I seem to do well with NASA and NSF, achieving success rates higher than random rates. I feel a bit discouraged with the DoD but feel motivation to try harder, as I have heard that getting my foot in the door is hard but, once in, is a fruitful collaboration.
Conclusion
The result that money won is correlated with effort is mentally obvious but to see that reflected in a rigorous data analysis is emotionally necessary and reassuring.


